Anyone who has read my book about the Victorian planning system (amongst many other things I’ve written) will know I’m not a fan of the VicSmart system of fast-track permit applications. I have long argued that it has made the system more complex to administer, and creates a punishing, staff-burning grind at councils without providing any notable tools to help them assess applications. The system has contributed to system bloat – it is a big part of why the General Residential Zone has increased from its simple and clearly-structured six-and-half pages in 2013 to a much more complex 12-and-a-bit now, for example – and led to some clearly poor outcomes, such as preventing the consideration of sustainability issues on applications for solar panels.
However I was interested in what we can see from the data about whether VicSmart is achieving its objectives, considered on its own terms purely as a fast-track mechanism. I came up with the following three graphs from DELWP’s PPARS permit activity data.
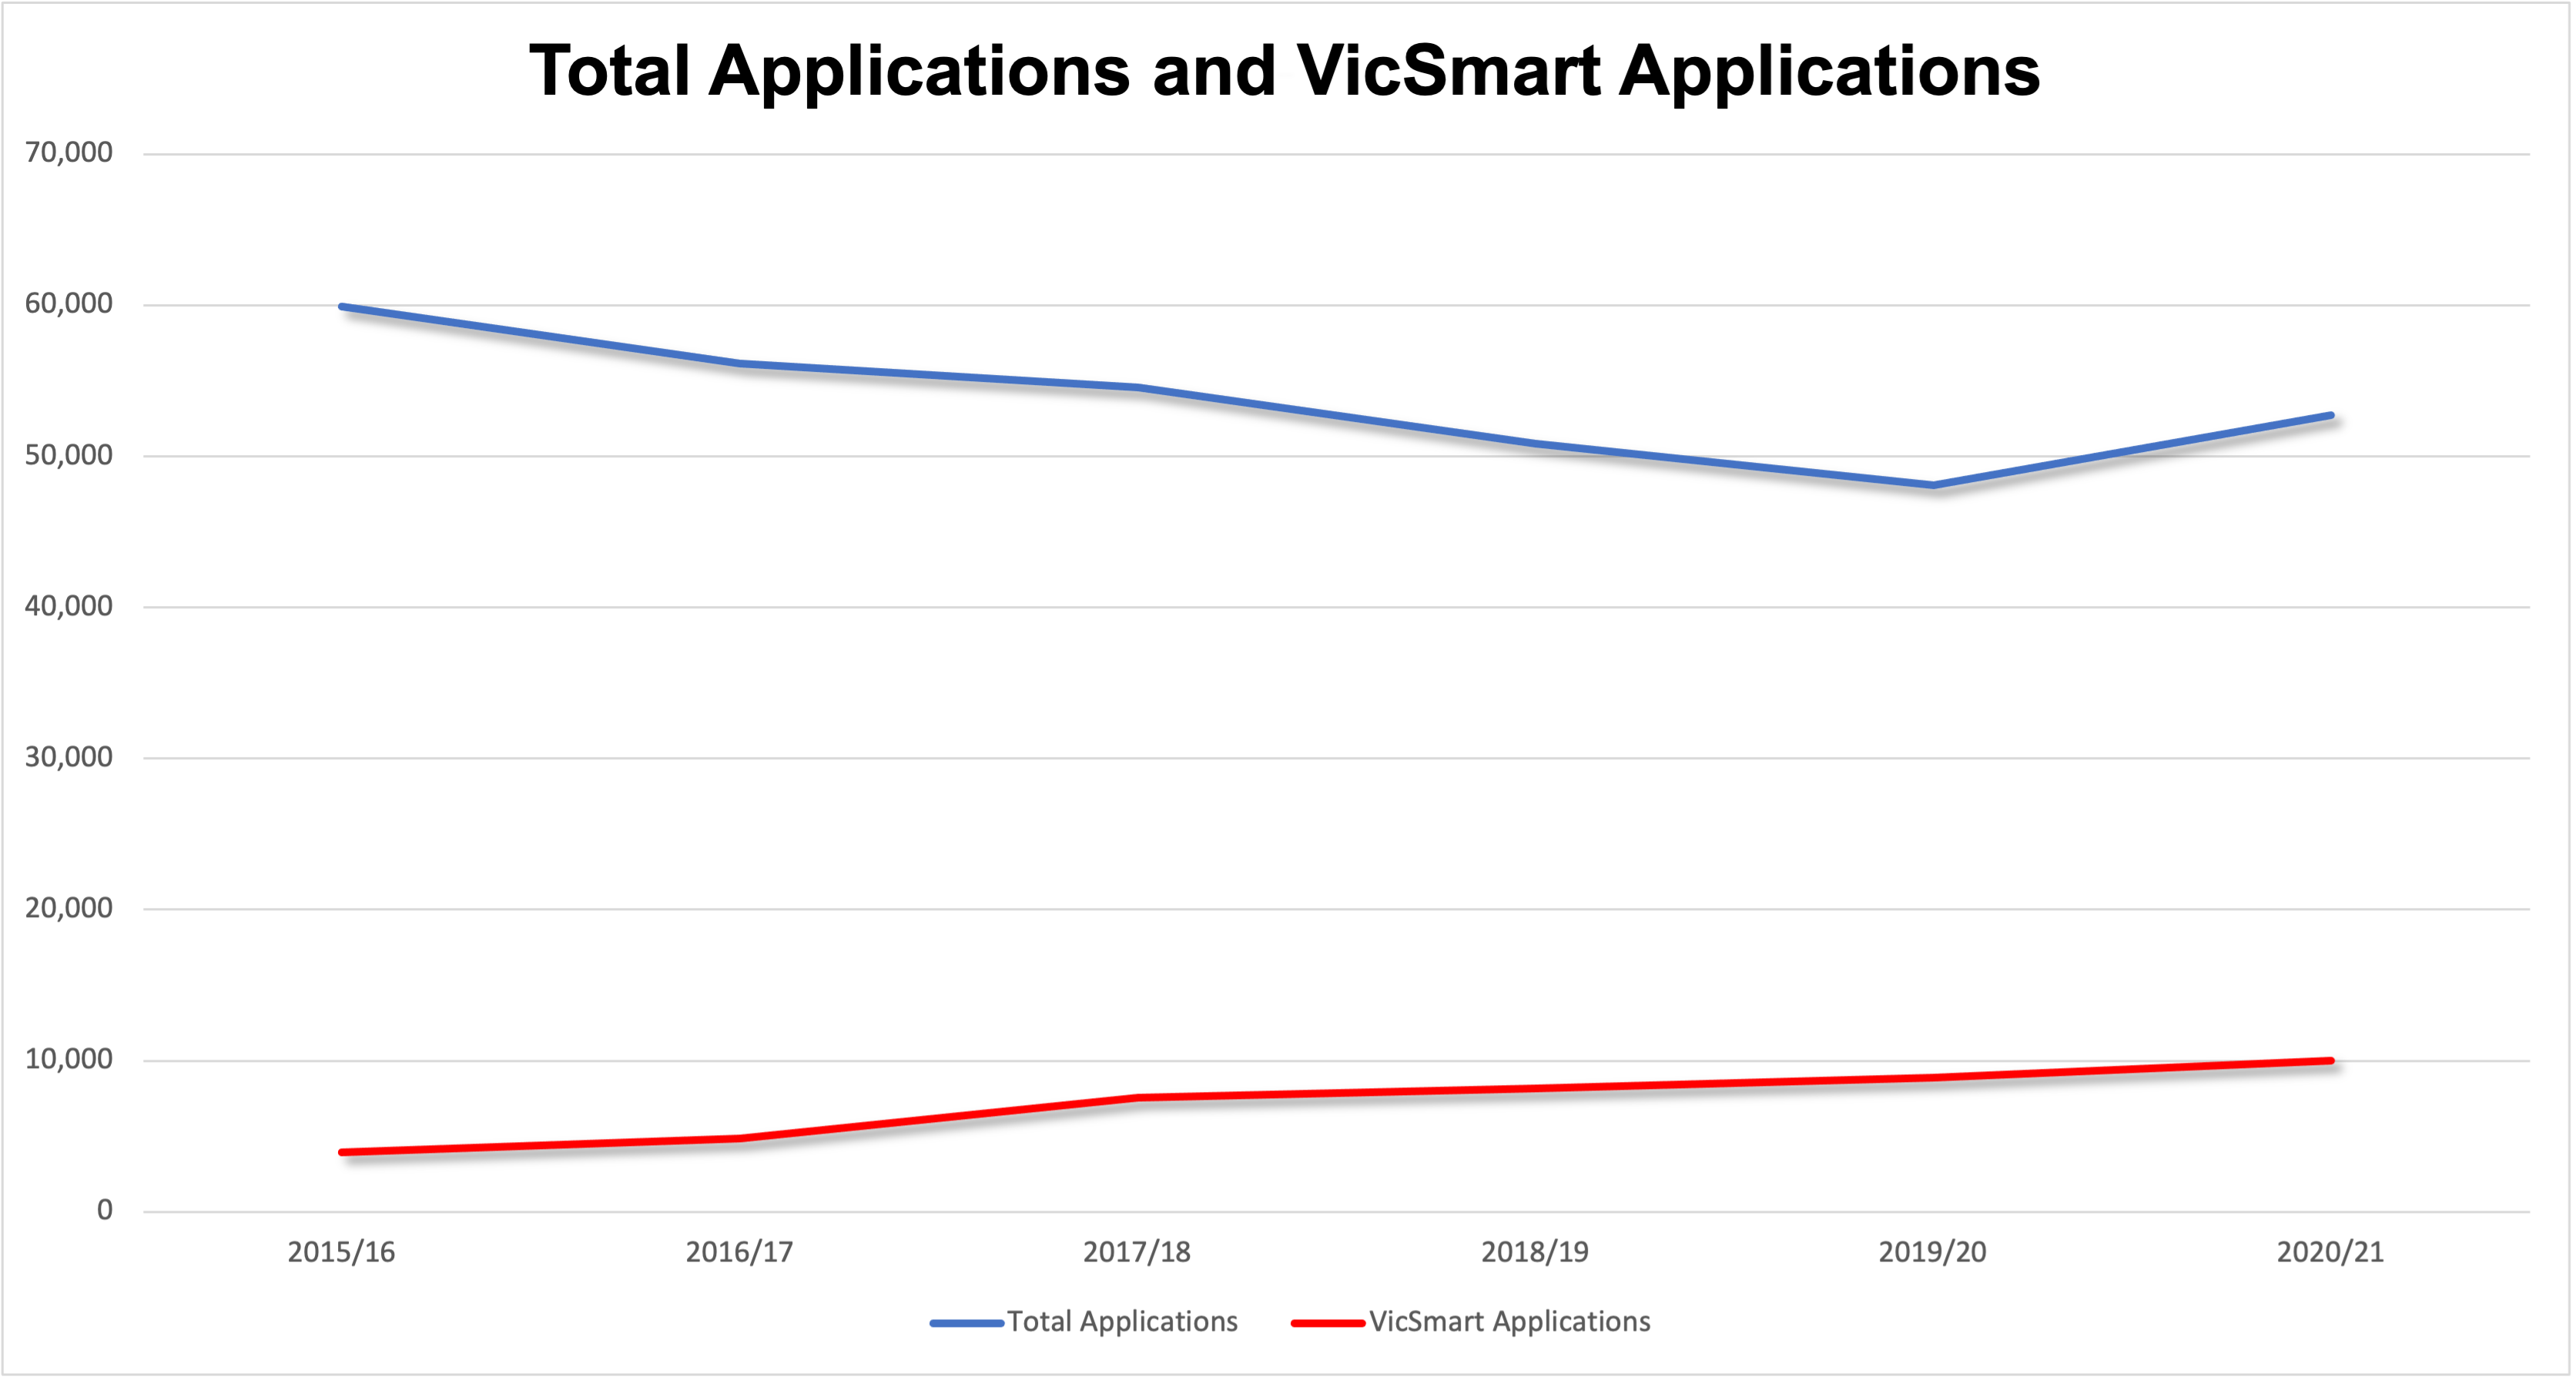
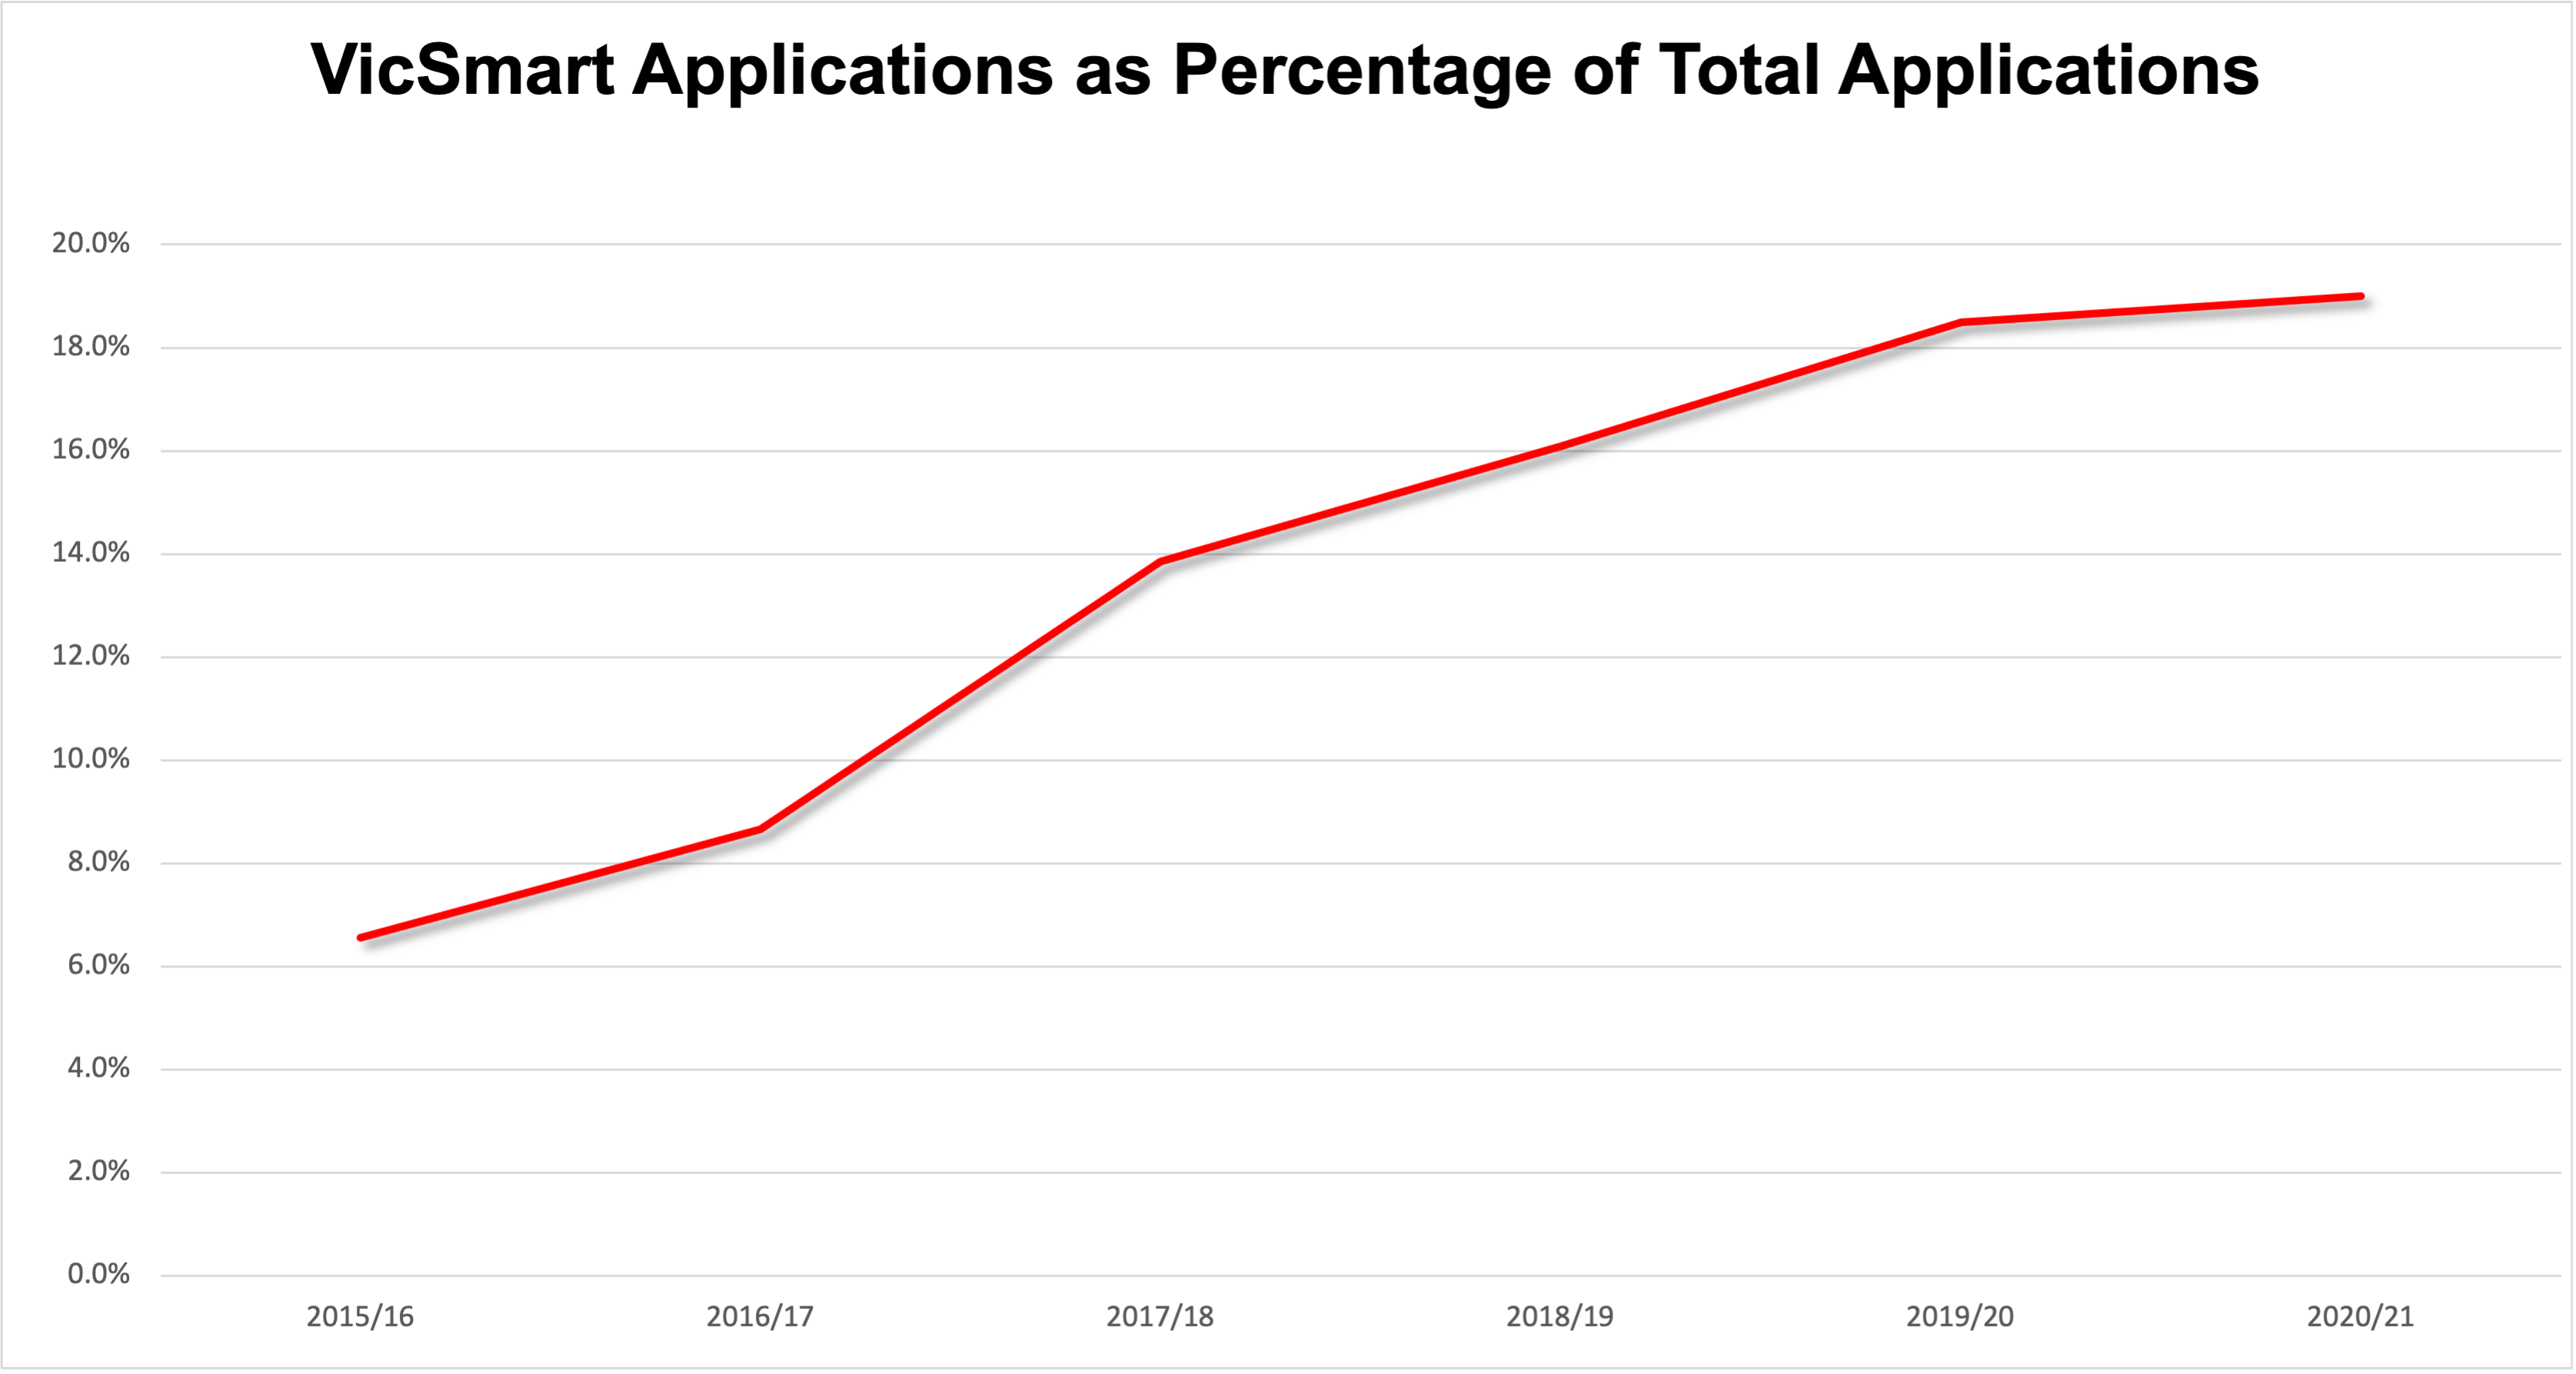
The first shows the total numbers of applications in the system compared to VicSmart applications (VicSmart was introduced in 2014 but PPARs doesn’t record VicSmart numbers before 2015/16). The second then shows VicSmart as a percentage of applications, making slightly clearer the share of total permit activity going through the stream. This started at 6.6% in 2015/16 and increased particularly sharply as a result of the Smart Planning reforms in 2017-2018; just under one in five applications (19%) now go through the stream.
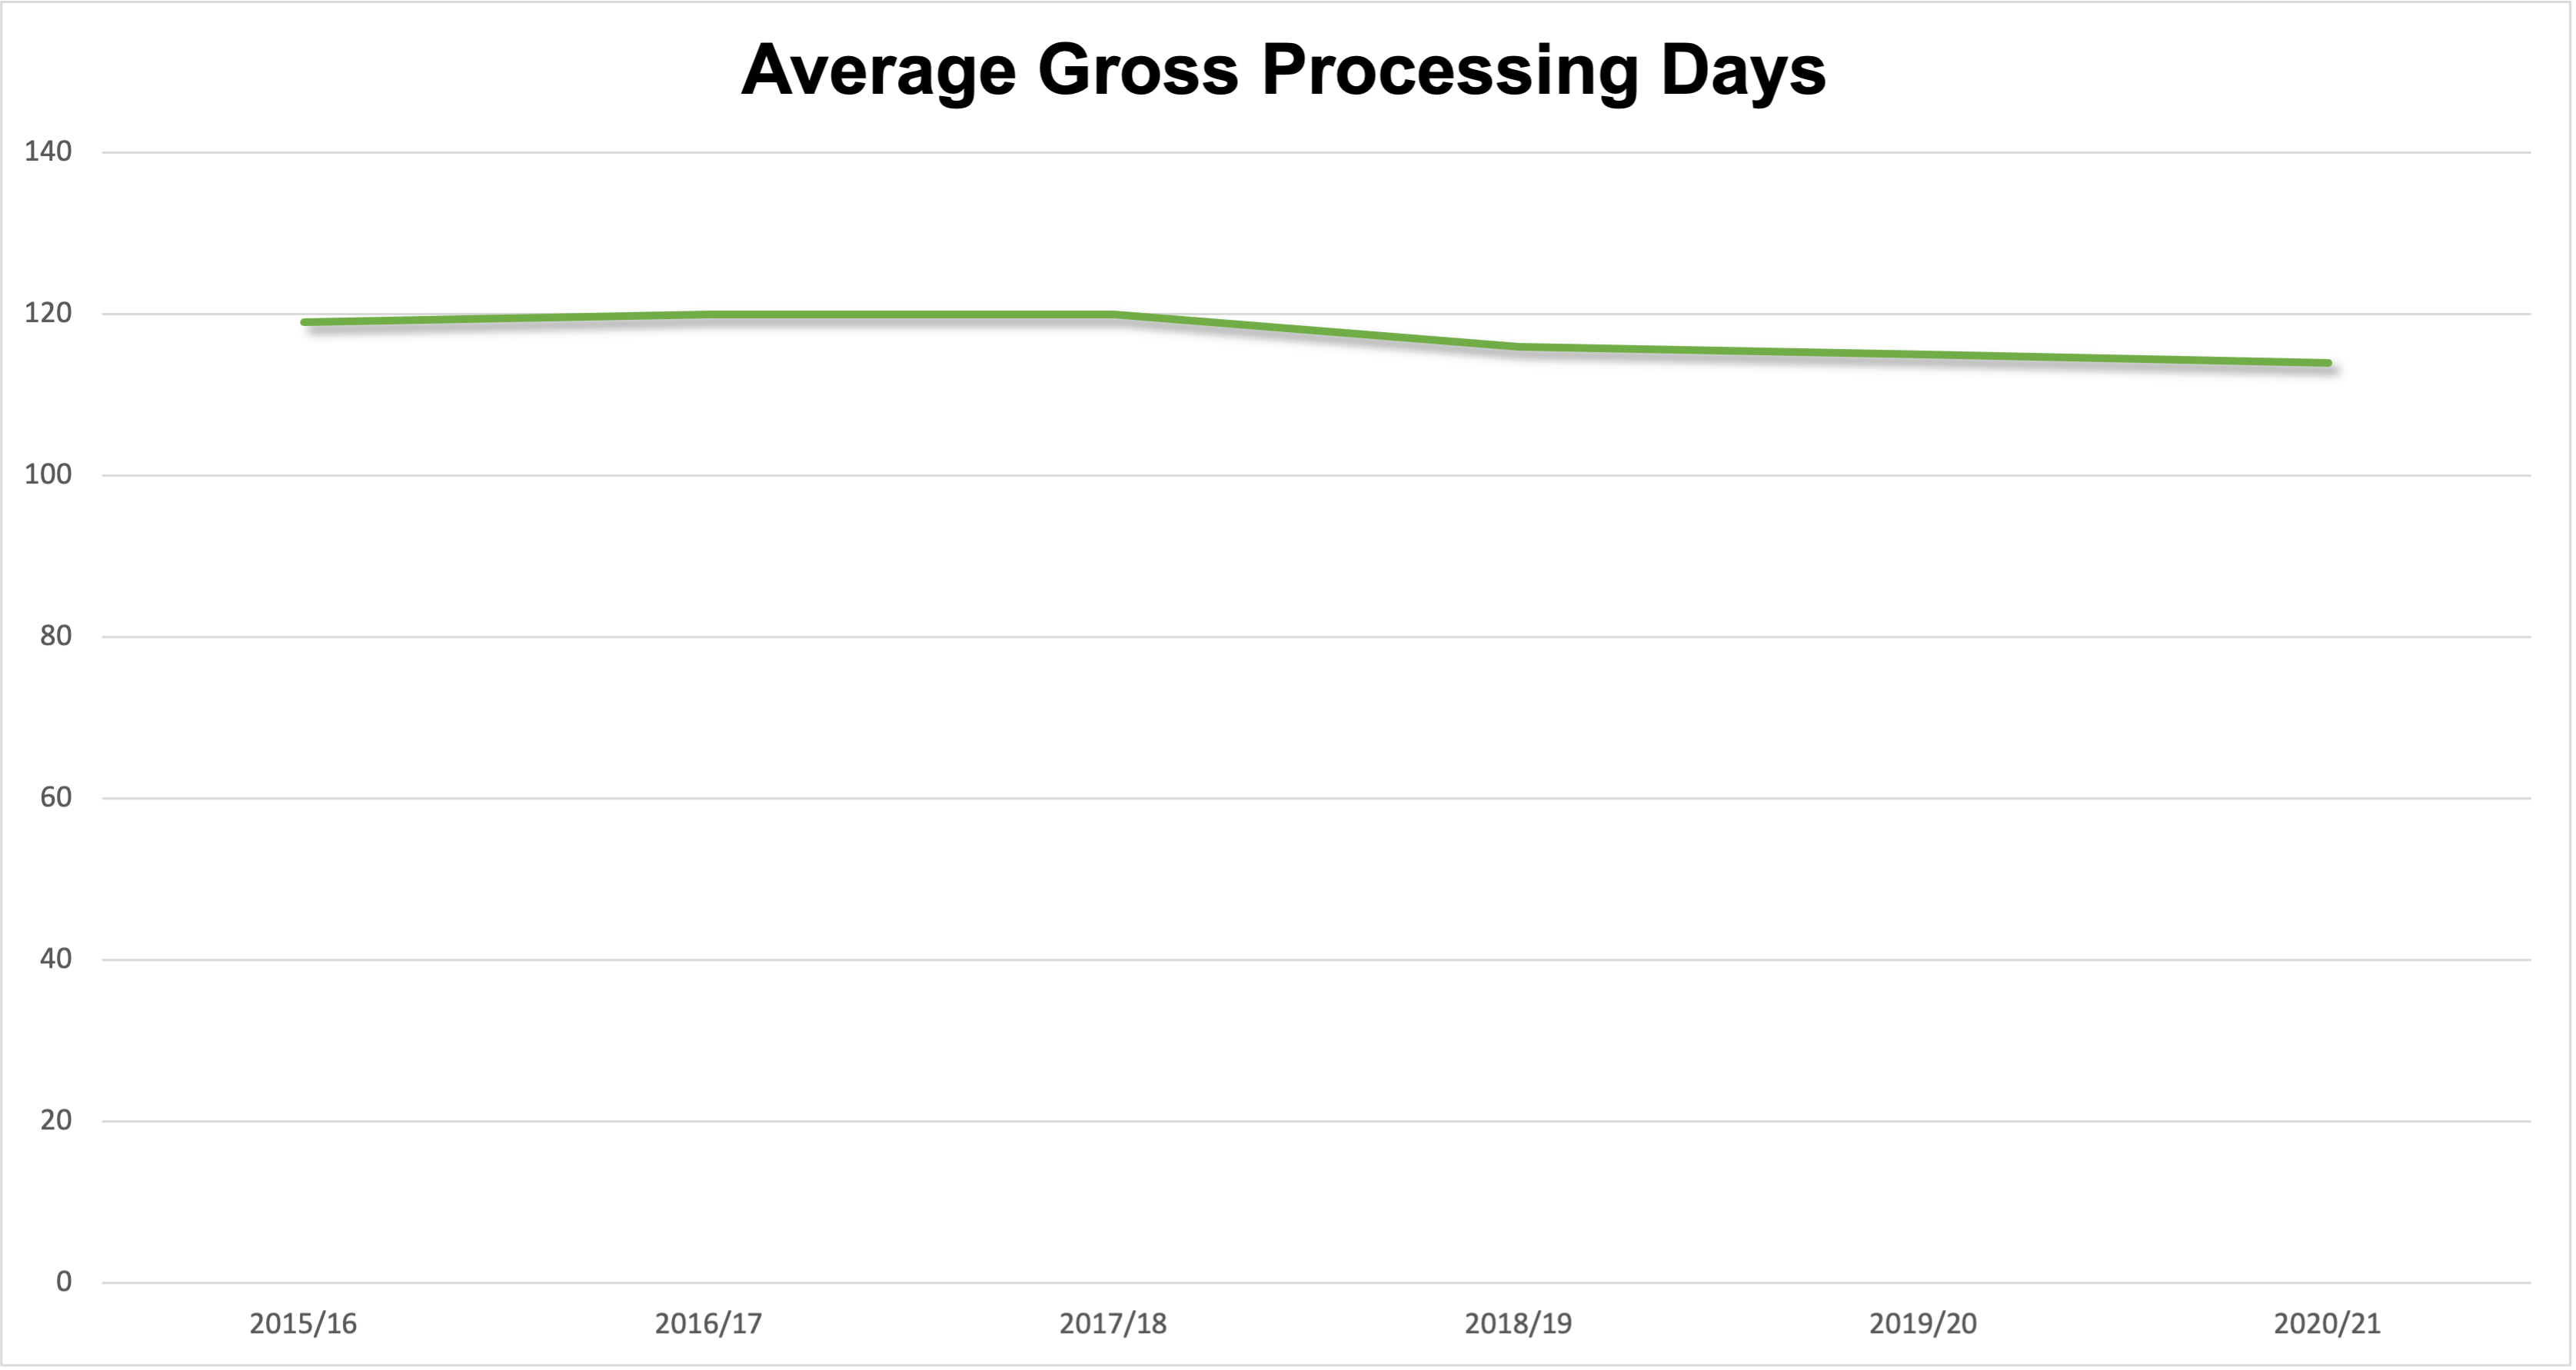
The final graph shows average gross processing days across both normal and VicSmart streams. This was 119 in 2015/16, ticked up marginally in the next couple of years to 120, and dropped down modestly from 2018/19 onwards, finishing at 114.
My interest in gross processing days is because I have always argued that VicSmart does little to assist in processing applications more quickly. It therefore seems likely to me that the fast-tracking of VicSmart applications is achieved mostly through reallocation of resources, rather than actual efficiencies. (In other words, some applications will be dealt with more slowly as a result of the fast-tracking of VicSmart matters). Gross processing days should give us a sense of whether there is an overall system efficiency being achieved.
These graphs suggest any such effect is modest.
It is true that there is a step down in processing times in 2018/2019, which does make some sense given the aggressive expansion of VicSmart ahead of this period – as shown in the second graph, the proportion of applications going through the system doubled between 2015/16 and 2018/19.
However it is worth remembering that these applications went from a statutory processing time of 60 days to 10 business days. If such a significant volume of applications were being dragged down to 10 days from a notably higher number, one would hope to see a more pronounced effect on gross times than is seen in this data. That the change is so modest (just over a 4% reduction) suggests that the VicSmart applications have not been significantly sped up, and / or other applications slowed down to compensate for much of the additional speed in the aggregate timeframe numbers. (I think the latter is probably a more pronounced effect, but this is just an educated guess.)
The other point to note is that application numbers are trending down through most of the time period in question. That should, all other things being equal, result in some improved efficiencies. (Of course, the Covid-19 pandemic is a huge system disruption that effects the tail end of this period – but I’m not sure there is any obvious Covid story to tell either way from this data).
If there is some timeframe improvement from reduced total workload – which is hard to prove but seems to me eminently plausible – then the reduction in gross processing days attributable to VicSmart would be a subset of the modest improvement visible in this graph.
There is lots of uncertainty here, obviously, and the PPARS data doesn’t break out some numbers that would be helpful in understanding what is going on, such as average timeframes for non-VicSmart applications.
However, given how central VicSmart has been to the reform agenda for the last decade, and the considerable problems the system causes, one would hope to see some more clearly detectable system-wide impact. A 4.2% reduction in gross timeframes in a period where application volumes dropped by 12% is, I would think, a very poor return on the effort devoted to the mechanism.
Perhaps this isn’t fair; perhaps DELWP have better data or analysis that demonstrates a system-wide benefit. If anyone is aware of such analysis, I’d love to see it. Certainly I think we need more evidence before more of our eggs get thrown in the VicSmart basket.